Quantifying Impact: Calculating ROI from Automated Content Programs
Introduction
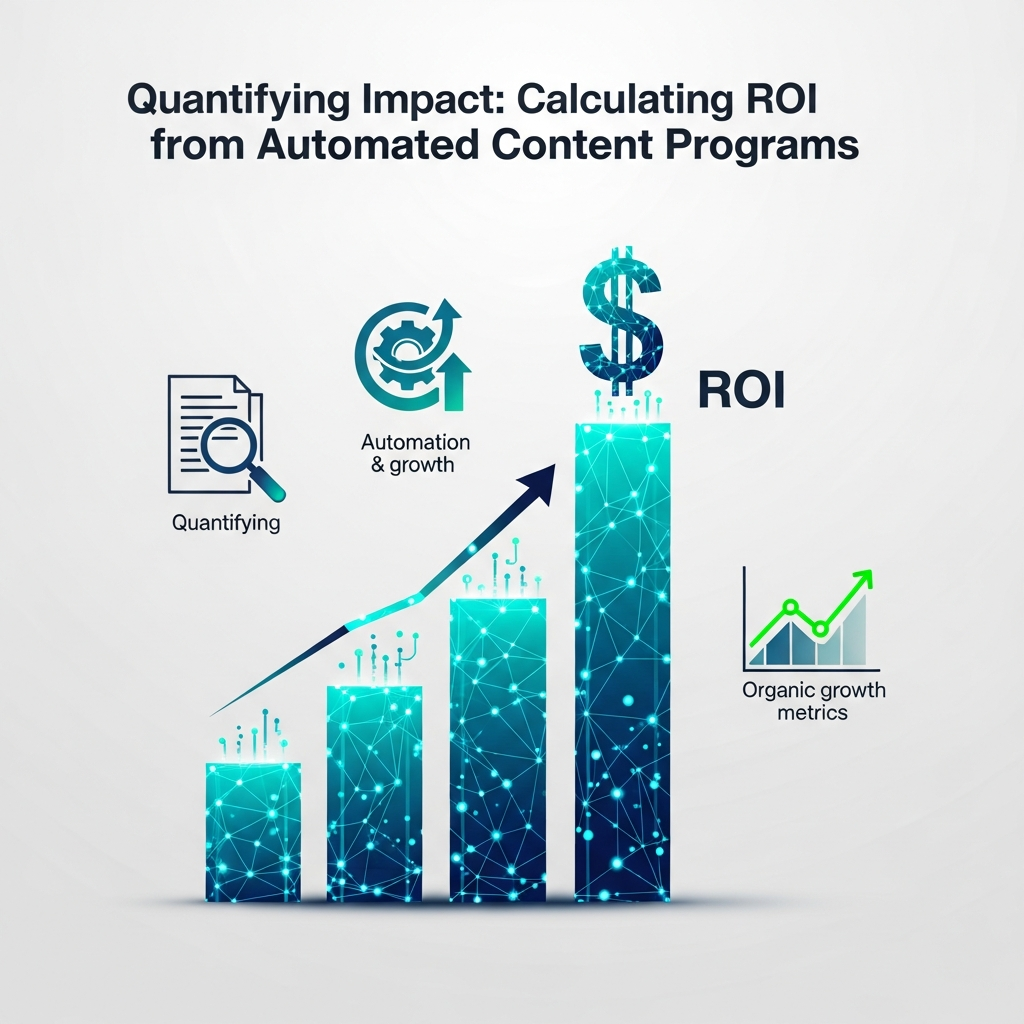
Automation has transformed how content teams operate at scale. When done well, automated content programs can accelerate publishing, improve consistency, and unlock new growth channels. Yet for decision-makers, the true value lies in a transparent framework: a clear return on investment (ROI) that ties activity to revenue, costs, and strategic outcomes.
This guide presents a practical framework for calculating SEO automation ROI. It covers data sources, attribution approaches, and a step-by-step method to quantify impact. The goal is to give business and marketing leaders a repeatable model they can apply to MOFU and BOFU decisions, not just a one-off calculation.
Throughout this article, you’ll find actionable checklists, example calculations, and recommended dashboards to operationalize measurement. For readers seeking hands-on guidance on editorial workflows and scalable publishing, see our related content at Editorial workflows for agencies, and explore general tooling insights at our blog index.
To ground the discussion, we’ll reference common data sources you likely already use, including analytics, Search Console, and CMS data. We’ll also discuss how to present ROI to stakeholders in a way that’s concrete, actionable, and aligned with business goals.
ROI Framework for Automated Content Programs
At its core, ROI is a comparison between the value generated by an initiative and the cost to execute it. For automated content programs, that means measuring incremental revenue or value that can be attributed to the program minus the program’s total cost. A simple, scalable formula is:
ROI = (Incremental Net Profit from Content Program - Total Cost of the Program) / Total Cost of the Program
Incremental Net Profit equals the additional revenue the program drives minus any direct costs tied to fulfillment. In practice, it’s rarely a single magic lever; the program improves multiple metrics—organic traffic, conversions, engagement, and downstream brand value—that together create measurable value over time.
Two important nuances shape this calculation: - Time horizon: ROI compounds as content compounds. Choose a horizon (typically 12–24 months for content programs) and model month-by-month incremental impact. - Attribution: multi-touch attribution is often necessary because content interactions occur across sessions and devices. A robust model distributes credit across touchpoints to avoid over- or under-attributing impact.
While revenue is the most direct signal, ROI can also reflect cost savings, speed to publish, or improvements in lifecycle metrics. For example, faster publication cycles may free capacity for higher‑value initiatives or reduce compliance risk, both of which have monetary equivalents.
In addition to ROI, it’s helpful to quantify the strategic value of automation: increased publishing cadence, improved content consistency, and better alignment with search intent. These factors can indirectly influence ROI by boosting trust, brand authority, and long-term rankings.
Practical takeaway: start with a simple ROI model, then layer complexity as you mature—multi-touch attribution, scenario planning, and sensitivity analyses. Your goal is a defensible framework that stakeholders can use to evaluate, compare, and optimize the program over time.
Data Sources & Attribution
Accurate ROI relies on reliable data. Collect inputs from multiple sources to capture the full effect of automated content, including revenue signals, engagement metrics, and SEO performance indicators.
Where to pull data
- Analytics platform (e.g., traffic, conversions, revenue, average order value, retention). - CMS and publishing workflow data (publication dates, cadence, content volume). - Search Console and SEO analytics (impressions, clicks, click-through rate, keyword rankings). - Advertising and attribution data if the content program intersects paid campaigns.
Attribution models
Choose an attribution approach that fits your business model and data quality. Common options include: - Last touch: credit goes to the final interaction before conversion. Simple, but often underestimates top‑of‑funnel impact. - Multi-touch: distributes credit across multiple interactions (first touch, mid-funnel, last touch). More representative for content programs. - Time-decay: gives more credit to later interactions but still recognizes earlier engagement. - Data-driven: uses actual user-level data to estimate credit allocation; requires richer data and modeling capability.
Implementing a blended approach—start with a transparent multi-touch model and validate with a data-driven check when possible. Document assumptions and run sensitivity analyses to understand how attribution nuances affect ROI estimates.
Pro tip: align attribution with your business questions. If you’re prioritizing long-term brand impact, give more weight to top-of-funnel interactions. If you’re optimizing for conversions, emphasize mid-to-late funnel signals.
Internal references can help deepen this understanding. For example, our broader content strategy guidance discusses scalable editorial workflows at Editorial workflows for agencies and broader publishing patterns in the blog index.
If you’re evaluating schema and structured data as part of your ROI story, consider using a schema validator to ensure pages are optimized for search. See Schema Validator for a quick check.
Key Metrics to Track
ROI is only as good as the data that feeds it. Track a mix of revenue-driven and efficiency metrics to understand both direct and indirect value from automation.
Revenue and conversion metrics
- Incremental revenue attributable to content-driven visits
- Revenue per visitor (RPV) and average order value (AOV) trends
- Conversion rate on pages published or updated via automation
SEO and content performance
- Organic traffic growth by topic with linear attribution to automated content
- Keyword ranking improvements and search visibility
- Internal linking coverage and content freshness scores
Operational and efficiency metrics
- Publish cadence and time-to-publish improvements
- Content production cost per article or per word
- Writers, editors, and automation tooling utilization rates
Combine these metrics into a dashboard that updates regularly. A practical approach is to segment metrics by MOFU vs BOFU impact to show where automation moves the needle in each funnel stage.
Remember: metrics should be understandable by stakeholders who may not be data professionals. Use visuals, not just tables, to communicate ROI trends and the story behind the numbers.
Building Your ROI Model: A Step-by-Step Guide
Follow these steps to construct a robust ROI model for automated content programs.
1) Define scope and time horizon
Decide which content programs and channels are in scope. Determine a 12- to 24-month horizon to capture ongoing SEO benefits and content maturation. Clearly document what counts as incremental impact versus baseline activity.
2) Capture all costs
Include software licenses, AI/content generation costs, editors, and CMS integration expenses. Don’t forget indirect costs like project management time and setup fees. Consider opportunity costs if automation redirects resources from other priorities.
3) Identify incremental revenue signals
Isolate revenue that can be plausibly tied to the content program. This often means looking at revenue lift from organic channels, then attributing a share to the program via your chosen attribution model. If direct revenue is hard to isolate, quantify surrogate value such as qualified leads, trial signups, or engagement metrics that correlate with pipeline.
4) Build scenario analyses
Model multiple scenarios: baseline (no automation), moderate lift, and optimistic lift. Use ranges for uncertain inputs like incremental traffic, conversion uplift, and average order value changes. Present best-case, worst-case, and expected-case outcomes.
5) Run sensitivity analyses
Test how changes in attribution assumptions, content cadence, or cost structure affect ROI. This helps stakeholders understand where the model is most sensitive and where to invest to maximize ROI.
6) Create a repeatable process
Document data sources, formulas, and dashboards. Set cadence for data refresh (monthly or quarterly) and establish governance for data quality and model updates.
Practical checklist: define inputs, confirm data quality, select attribution approach, draft the ROI formula, build a dashboard, review with stakeholders, and iterate quarterly.
MOFU/BOFU ROI Considerations
Mid-funnel (MOFU) and bottom-funnel (BOFU) effects often diverge in their ROI timing and signal strength. Content that educates and builds trust tends to lift brand affinity and long-term conversions, while product-focused content can drive quicker purchases. Your ROI model should reflect both kinetic (short-term) and durable (long-term) value.
MOFU strategies that influence ROI
- Content that explains product value, outcomes, and use cases
- Case studies and benchmarks that reduce friction in the buying process
- Internal linking structures that surface relevant product pages and comparisons
BOFU strategies that influence ROI
- Product pages and category pages optimized for intent and conversion
- Prompt call-to-action experiments tied to content interactions
- Clear schema, reviews, and FAQ sections that reduce friction at checkout
Key takeaway: a well-balanced ROI model captures both MOFU and BOFU impacts. Separate reporting by funnel stage helps communicate where automation drives the most value and where you should invest in optimization efforts.
Practical Example: A Worked ROI Scenario
Note: The numbers below are illustrative and intended to show how you might structure calculations. Replace with your own data in a live model.
Assume a content automation program spanning 12 months, with the following inputs: - Total program cost: $120,000 (software, editors, and CMS integration) - Incremental monthly organic revenue: $18,000 on average from content-driven traffic (12 months: $216,000) - Incremental marketing costs directly tied to the program: $10,000 total over the year - Attribution credit: 60% of incremental revenue attributed to the automated content program (to reflect cross-channel effects) - Net incremental profit: $216,000 - $10,000 = $206,000; attributed value: 0.60 * $206,000 = $123,600 - ROI: (Incremental value - Cost) / Cost = ($123,600 - $120,000) / $120,000 = 3.0%
In this simplified example, the program yields a modest ROI within a year but has demonstrated strong performance potential as content maturity grows and more pages accrue rankings. If the attribution credit increases to 80% and the incremental revenue grows to $25,000 per month, ROI would improve dramatically. This demonstrates the importance of attribution assumptions and growth in input variables.
Use dashboards to show monthly contributions: track impressions, clicks, visits, signups, and conversions attributed to automated content. Then compare against the total cost to reveal monthly ROI trends and inform decision-making about scaling the program.
Internal reference: explore related editorial processes and content cadences in our editorial workflow guide, linked earlier, and validate structured data adoption with the schema validator tool.
Pitfalls & Best Practices
ROI calculations can be misleading if you miss key elements. Here are common pitfalls and how to avoid them:
Pitfalls to avoid
- Over-attributing revenue to a single program when multiple initiatives run concurrently.
- Ignoring time lags between content publication and impact realization.
- Failing to separate incremental lift from natural seasonality or existing growth trends.
- Using vanity metrics (likes or social shares) without a clear link to revenue or profitability.
Best practices
- Document assumptions and use transparent attribution rules that stakeholders can audit.
- Update models regularly as data quality improves and the content library compounds.
- Publish a clear ROI narrative that ties content activity to business outcomes, not just metrics.
As you mature, test different attribution models and compare the outcomes. Schema-driven pages and structured data help search engines understand content intent, potentially improving organic visibility and contributing to ROI. For a practical validation, consider running a parallel test where a subset of pages remains non-automated to isolate incremental effects.
Getting Started: Roadmap and Next Steps
To implement ROI tracking effectively, start with a lightweight framework and scale as you gain confidence in data quality and attribution fidelity.
Recommended steps
- Define the scope of the automated content program and select a time horizon (12–24 months).
- Catalog costs and identify data sources across CMS, analytics, and SEO tools.
- Agree on an attribution model and document the assumptions.
- Build a simple ROI calculator and a monthly dashboard that updates automatically.
- Review results with stakeholders, iterate on data quality, and adjust the program scope as needed.
As you progress, consider deeper integration with CMS workflows and editorial calendars. For broader operational guidance, you can explore our main blog hub and specific editorial workflow posts to align publishing cadence with ROI reporting.
If you’re evaluating a broader automation platform, compare capabilities like white-label reporting and multi-site management. You can also validate data integrity using schema tools to ensure your pages are properly structured for search engines.
For additional context and related discussions, visit Editorial workflows for agencies and the blog index at our blog index.
To conclude, ROI from automated content programs is attainable with disciplined measurement, thoughtful attribution, and a clear plan to scale. Use the framework above as a starting point, then tailor it to your business context and data realities.