Measuring ROI and Governance in Automated SEO: Dashboards That Prove Value
Why ROI dashboards matter for automated SEO
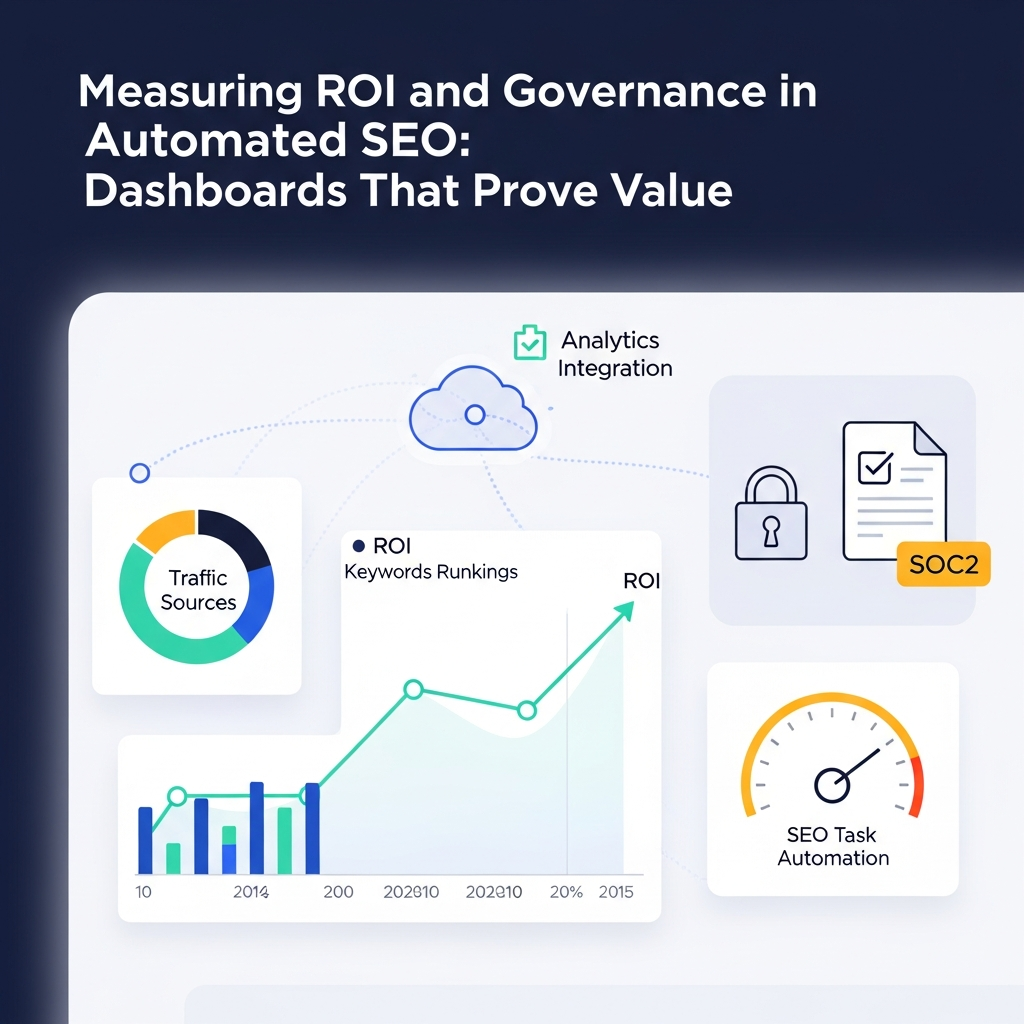
Automation accelerates content creation, optimization, and distribution across multiple sites. But without a clear ROI framework, stakeholders struggle to connect automated activities to business value. ROI dashboards translate activity into outcomes, helping leaders prioritize investments, justify tool selections, and align SEO programs with broader growth targets.
ROI dashboards also support governance by making performance traceable. When leadership can see how automation affects traffic, conversions, and revenue over time, it becomes easier to justify scale, security investments, and vendor partnerships. For teams managing many sites or languages, centralized dashboards reduce manual reporting toil and improve decision speed.
Core metrics and building blocks of ROI dashboards
A robust ROI dashboard for SEO automation blends input, output, and efficiency metrics. The goal is to quantify not only what happens, but also how efficiently it happens when automation is in play.
- Input metrics: automation capacity (articles per week, keywords researched per sprint, publishing cadence), tool costs, and human-hours saved.
- Output metrics: organic visits, time on page, pages per session, conversion rate from organic traffic, revenue attributed to organic channels.
- Efficiency metrics: publishing speed, content creation cycle time, error rate in content outputs, rework rate, and the rate of content optimizations applied per week.
- Quality metrics: indexability, crawlability, on-page optimization coverage, semantic relevance scores, and content quality checks powered by governance rules.
- ROI indicators: incremental revenue from SEO, cost savings from automation, gross margin impact, and net present value of ongoing SEO initiatives.
When designing these blocks, map each KPI to a business objective (e.g., revenue growth, cost reduction, time-to-market) and create simple, tabular formulas that can be re-used across sites and teams. This modular approach makes it possible to scale dashboards as you add more domains or markets.
Analytics integration: data sources and quality for trustworthy dashboards
High-quality analytics integration is the backbone of credible dashboards. Typical data sources include Google Analytics 4, Google Search Console, the CMS and publishing system, keyword research tools, CRM/commerce data, and any internal BI or analytics platform in use.
To ensure data integrity, establish a data model that aligns with your KPI definitions. Create a single source of truth for key metrics, and implement automated data validation rules. For example, verify that revenue attributed to organic channels aligns with order data and that reporting periods are consistent across dashboards.
Practical tips:
- Standardize UTM tagging and attribution models across campaigns to avoid fragmented data.
- Set up automated data quality checks that alert the team on anomalies (e.g., sudden traffic drops or changes in conversion rate).
- Leverage API integrations where possible to minimize manual uploads and ensure near real-time visibility.
As you assemble data sources, consider linking to relevant resources in our blog catalog for deeper dives on editorial workflows and scalable publishing. For example, you can read about editorial workflows designed for agencies at scale in the following piece: Editorial workflow for agencies planning, writing, and publishing at scale.
For a broader perspective on automation tooling and governance, visit our homepage or the main blog hub: ASimpleTool homepage and ASimpleTool blog.
Governance and SLAs in enterprise SEO
Governance processes define who can access dashboards, modify data pipelines, and approve changes to a multi-site SEO program. In an enterprise context, SLAs with vendors and internal teams create predictable delivery timelines, quality thresholds, and escalation paths when issues occur.
Key governance practices include:
- Role-based access control (RBAC) with audit trails for data and dashboards.
- Standardized KPI definitions and reporting intervals (weekly, monthly, quarterly).
- Change management for data models, metrics, and dashboard layouts.
- Vendor governance: documenting response times, support levels, and data ownership terms.
For enterprises, governance is closely tied to SOC2 and other security frameworks. See the SOC2 considerations discussed below for details on keeping data safe in scalable, multi-site environments.
SOC 2 compliance and security considerations
SOC 2 compliance becomes a practical baseline for SEO platforms handling sensitive business data, including revenue signals and user behavior patterns. While a dashboard itself is often read-only for most users, the data pipelines and third-party integrations must adhere to strict controls.
Security considerations include:
- Encryption at rest and in transit for data at every stage of the pipeline.
- Access controls with two-factor authentication and least-privilege permissions.
- Regular security assessments and third-party risk reviews as part of vendor governance.
- Comprehensive incident response and data breach notification processes.
When evaluating ROI dashboards for automation, ask vendors about their SOC2 status, audit reports, and data handling practices. This aligns governance with the security posture expected by enterprise stakeholders.
Designing dashboards for scale and governance
Scalability means more than adding dashboards for new sites. It means creating a unified visualization layer that supports multiple brands, languages, and markets without sacrificing performance or clarity.
Design tips for scale:
- Offer tiered views: executive dashboards for leadership, manager dashboards for channel leads, and analyst views for data teams.
- Adopt modular dashboard components that can be reused across sites, ensuring consistency and faster onboarding.
- Support localization and multilingual reporting where needed, with language-aware metrics and labels.
- Provide white-label capabilities or partner-friendly features if you serve agencies or large corporates.
For practical examples of scalable workflows, explore our Sao Paulo regional automation piece that discusses localized publishing at scale: Sao Paulo: automating publication for Brazilian ecommerce.
ROI calculation methodologies and practical formulas
Calculating ROI for automated SEO dashboards requires translating activity into business impact. A simple framework uses three components: incremental value, time savings, and costs. The core equation can be stated as:
ROI = (Incremental Revenue + Time Savings Value - Total Costs) / Total Costs
Incremental revenue captures the lift from improved organic visibility, higher click-through rates, and better conversion on optimized pages. Time savings quantify the reduction in manual reporting and content-creation overhead. Costs include platform licenses, data integration expenses, and any professional services tied to implementation.
Example scenario:
- Incremental revenue from organic channels: $120,000/year
- Estimated annual time savings: 320 hours @ $50/hour = $16,000
- Annual costs (tools, licenses, maintenance): $40,000
ROI = ($120,000 + $16,000 - $40,000) / $40,000 = 2.2x annual return. While hypothetical, such calculations illustrate how dashboards convert abstract automation benefits into tangible business value. Customize the model to reflect your pricing, scale, and regional differences.
For more on analytics integration and governance considerations, our editorial workflow piece demonstrates how automation decisions intersect with governance in a content-focused context. See the editorial workflow article linked earlier for additional context.
Implementation playbook: steps to deploy ROI dashboards
Implementation should follow a disciplined, repeatable process. Here is a practical nine-step playbook:
- Discovery and objective framing: define business goals, success criteria, and stakeholders.
- KPI selection: choose a core set of metrics that map to revenue, efficiency, and risk reduction.
- Data inventory and mapping: list sources, data owners, and update frequencies.
- Data modeling: build a unified schema with consistent definitions across sites and languages.
- Prototype dashboards: create a minimal viable dashboard (MVP) for quick validation.
- Data quality validation: implement checks and alerts for data integrity.
- User testing and iteration: gather feedback from executives, marketers, and data teams.
- Rollout and training: provide role-based views and governance guidelines; enable self-serve access where appropriate.
- Governance handover: document SLAs, change control processes, and incident response steps.
To align with best practices, reference our general blog resources and governance-focused content, and consider sharing prototypes with a small pilot group before broader rollout. For an example of an practical workflow at scale, see our editorial workflow post, linked earlier.
Practical examples, pitfalls, and best practices
Real-world dashboards rarely start perfect. Common pitfalls include overloading dashboards with too many metrics, inconsistent data definitions across regions, and failing to tie metrics to business outcomes. To avoid these, adopt a phased approach: begin with a focused KPI set for a single site or region, validate data quality, and expand gradually while retaining clarity.
Best practices to adopt now:
- Start with business outcomes (revenue, profit, customer acquisition) and map each KPI to a concrete action.
- Keep executive dashboards lean, with a few high-level metrics and narrative context.
- Publish governance playbooks and data lineage diagrams so teams understand how data moves from source to dashboard.
- Automate routine reporting while reserving manual analysis for deeper investigations.
For further reading, explore the ASimpleTool blog for additional case studies and best practices in editorial workflows and automation, and consider following the internal resources on governance and organizational data strategies.
Internal resources:
- ASimpleTool homepage
- ASimpleTool blog
- Editorial workflow for agencies at scale
- Sao Paulo automation for Brazilian ecommerce
Closing thoughts
ROI dashboards for automated SEO are more than visualization tools. They are governance enablers, alignment accelerators, and a lingua franca for cross-functional teams coordinating content, analytics, and technology. When designed with clear metrics, robust data integrations, and strong governance, these dashboards prove value, support scale, and build confidence across executives and practitioners alike.