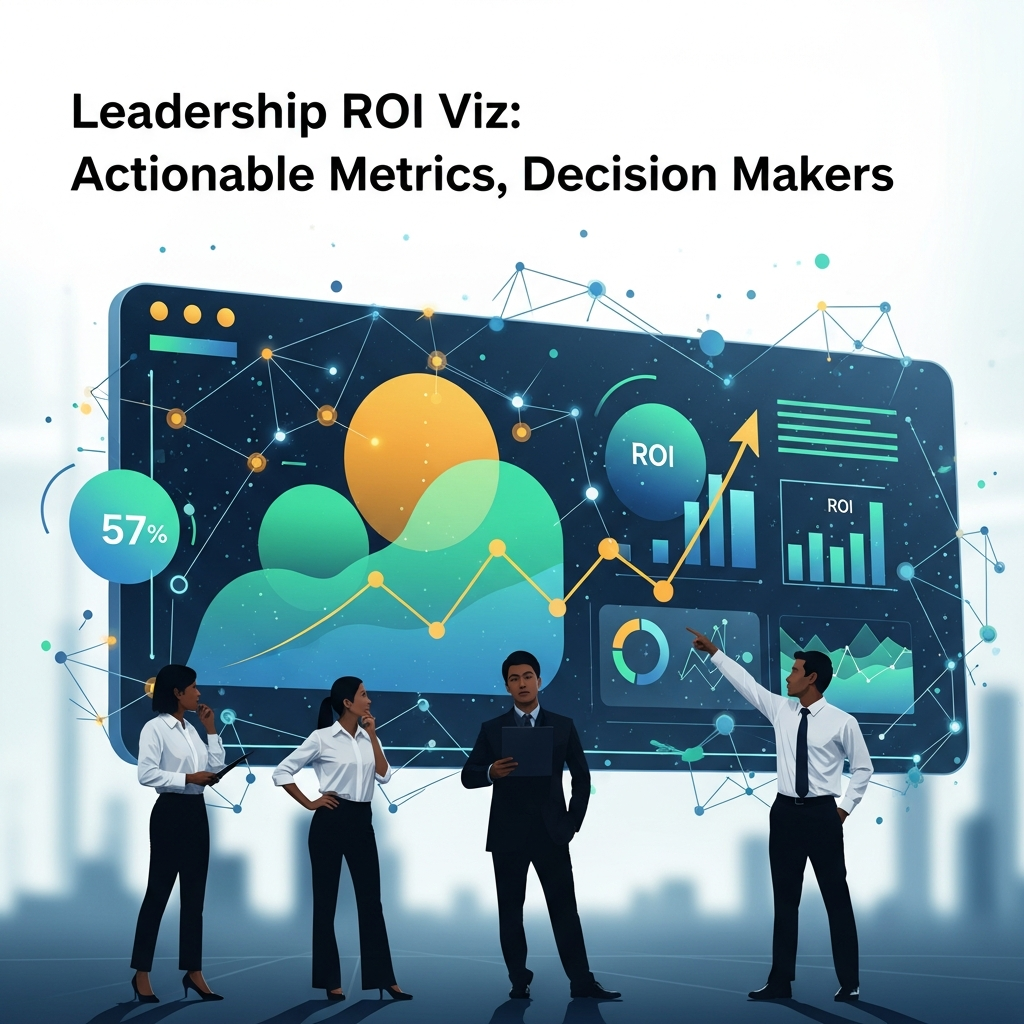
ROI Dashboards for Executive Automation: Actionable Metrics for Decision Makers
Why ROI dashboards matter for executive automation
Executives need a clear line of sight from automated content programs to tangible business outcomes. ROI dashboards translate complex data from multiple sources into concise, board-ready visuals. They reduce interpretation friction, enable faster decisions, and provide a defensible narrative for continuing or expanding automation initiatives.
A well-designed ROI dashboard does more than show dollars. It connects activities (content creation, publication, and optimization) with outcomes (traffic, engagement, conversions, and revenue). When leadership can see cause and effect in a single pane, it becomes easier to justify investments, align cross-functional teams, and set ambitious yet achievable targets.
In practice, executives value dashboards that summarize risk, opportunity, and trajectory. This means balancing performance metrics, operational health, and governance indicators in a way that remains accessible to non-technical stakeholders. The result is a shared language for evaluating automated programs across the enterprise.
Defining metrics: performance metrics and KPIs for automated content programs
The first step in building ROI dashboards is selecting the right set of metrics. You want a blend of leading indicators (inputs that predict outcomes) and lagging indicators (actual results after the fact). Start with a core of performance metrics that measure throughput, quality, and efficiency, then layer in business outcomes that executives care about.
Key performance metrics (primary)
Content velocity: how fast you publish new articles, posts, or pages. This reflects automation throughput and editorial capacity.
Automation accuracy: the rate at which generated content meets brand guidelines, SEO standards, and quality checks. High accuracy reduces rework and accelerates publishing.
Publish consistency: adherence to a scheduled cadence across sites or channels. Predictable publishing patterns correlate with audience trust and search visibility.
SEO readiness: alignment with on-page optimization, structured data, meta elements, and internal linking. This signals the program’s readiness to drive organic performance.
Supporting metrics (secondary)
Traffic and engagement: visits, page views, time on page, and scroll depth as a result of automated content outreach.
Lead generation and conversions: form fills, trial signups, or product purchases attributed to automated content flows.
Cost per piece of content: total automation cost divided by the number of publishable assets, useful for budgeting and ROI calculations.
Content quality signals: error rates, user feedback, and editorial sentiment to monitor long-term impact and brand health.
Common pitfalls to avoid
Avoid chasing vanity metrics that don’t translate into business value. Prioritize metrics that tie directly to revenue or strategic goals.
Be cautious of attribution gaps. Ensure you have a reasonable model for crediting automated content across channels and touchpoints.
Guard against data silos. Aggregation across CMS, analytics, e-commerce, and CRM is essential for accurate ROI calculations.
Building ROI dashboards: data sources, architecture, and governance
Successful ROI dashboards rest on clean data and thoughtful architecture. Start by mapping data sources, defining data owners, and establishing a governance cadence that preserves data integrity over time.
Data sources you need
CMS and content management data to track assets published, updates, and revisions. Analytics platforms (e.g., GA4) for traffic and engagement metrics. SEO tools for on-page optimization signals. CRM or marketing automation for lead and conversion data. Financial systems or attribution models to connect activity with ROI.
Operational systems for publishing cadence, content calendar status, and quality checks. Internal dashboards for governance and access controls to ensure reliability and auditability.
Data quality and governance
Establish data standards, validation rules, and versioned dashboards. Implement role-based access to protect sensitive information and ensure readers see the right level of detail.
Adopt a lightweight data model that can evolve. Start with a core schema and gradually add dimensions such as locale, product category, or site tier as needs grow.
Design principles for board-ready reporting
Board-ready dashboards communicate complex information quickly. Clarity, brevity, and context are the three pillars that distinguish effective executive dashboards from raw data dumps.
Visuals that resonate
Use sparklines to show trends over time, bar and column charts for comparison, and heatmaps to highlight priorities. Limit colors to a dozen hues that align with your brand and avoid chart overload.
Leverage trend lines and annotations to explain anomalies or milestones. Each visualization should answer a direct question a decision-maker might have.
Narrative structure
Pair visuals with a concise narrative that frames the business problem, the intervention (automation), and the resulting impact. A short executive summary at the top sets expectations for readers who scan dashboards quickly.
Include a one-page dashboard brief for meetings: a snapshot of ROI, confidence in data, and the next actions. This helps leadership stay aligned without diving into every data point.
Access, governance, and versioning
Protect sensitive metrics with access controls. Maintain version histories so stakeholders can trace changes to calculations, data sources, and visualization templates.
Document governance processes for updates, approvals, and changes in KPI definitions. A clear protocol reduces confusion during quarterly reviews.
Dashboards by stakeholder role
Different executives need different views. A single ROI dashboard can be organized into role-based tabs or pages so each reader is served the most relevant information.
Executive/board view
The top-level view should center on ROI, payback period, and risk. Include a narrative of value delivered by automation, pipeline health, and strategic opportunities that automation unlocks.
Keep the focus on outcomes: revenue impact, cost savings, and strategic milestones achieved through automation. Use concise bullets to bridge any gaps between data and decision-making.
Finance and operations view
Finance teams look for cost-to-value analyses, ROAS, and budget adherence. Translate automation costs into tangible savings and highlight areas where efficiency improved margins or reduced cycle times.
Operational dashboards should show SLA adherence, content quality rates, and time-to-publish metrics to demonstrate governance and reliability.
Marketing and content teams view
Content leaders want throughput, quality, and audience impact. Link automation metrics to content performance, SEO improvements, and editorial cadence to validate ongoing investments.
Offer actionable next steps: which topics to prioritize, where to accelerate automation, and how to refine prompts or templates to boost results.
Implementation checklist: from goals to governance
Use a phased approach to rollout ROI dashboards. Start with a pilot on a single site or business unit, then expand to multi-site automation as confidence grows.
- Define success: articulate the ROI objective and what metrics will prove it.
- Inventory data sources: identify where data lives and who owns it.
- Choose a core KPI set: start with a minimal viable dashboard and scale.
- Design templates: create standard layouts for consistency across teams.
- Pilot and iterate: run the pilot for 6–12 weeks, then adjust.
- Governance and access: set roles, approvals, and data sharing rules.
- Scale with safeguards: extend to more sites while preserving data quality.
Templates and use cases for common scenarios
Below are example dashboard templates you can adapt. Each is designed to illuminate ROI while remaining practical for daily use by executives.
- New product launch ROI dashboard: track content velocity, traffic uplift, and conversions tied to the launch window.
- Multi-site performance dashboard: compare site-level performance, governance compliance, and publishing cadence across regions.
- Editorial efficiency dashboard: measure content production costs, time-to-publish, and rework rate.
- SEO impact dashboard: connect on-page optimization signals to organic traffic and revenue growth.
Tools, integration, and governance: blending systems for reliability
Effective ROI dashboards integrate with a broad toolset. Prioritize systems that your team already uses to reduce friction and preserve data trust.
Key integration considerations include data latency, API access, schema standardization, and authentication controls. Plan for ongoing maintenance so dashboards stay accurate as tools evolve.
Remember to document data lineage and the calculation logic behind ROI estimates. Transparency builds confidence in executive reporting and supports regulatory or governance requirements.
To see how editorial workflows can scale with automation, explore our related content in our blog hub and case studies—for example, editorial workflow for agencies at scale and São Paulo automation for Brazilian e-commerce.
Measuring ROI and avoiding common pitfalls
ROI can be complex when multiple levers influence outcomes. Use a clear attribution model and document assumptions so stakeholders understand the basis for ROI estimates.
Be mindful of lag effects: automated content may take time to show SEO and engagement results. Include confidence intervals or scenario analyses to convey uncertainty and set realistic expectations.
Avoid data overload. Keep the dashboard lean and focused on the metrics that drive decisions. Regularly review the KPI set to ensure it remains aligned with evolving business goals.
Putting ROI dashboards to work: communication and next steps
Share dashboards in leadership meetings with a consistent cadence. Pair visuals with concise talking points that connect automation activities to strategic outcomes.
Plan quarterly reviews to refresh KPIs, prune irrelevant metrics, and incorporate new data streams. Use wins from the dashboard as proof points to secure continued investment in automation initiatives.
For more on editorial and automation topics, visit our blog hub or explore specific guides like editorial workflow at scale and Brazilian e-commerce publishing automation.